


You have heard of infographics at least once before in your life. Think of the random memes you used to see on your school’s social media page. Or you think of a company’s advertisement that provides a bunch of information that you have to scroll through to read.
These are a type of infographic. We’re going to go over some of the different types of infographics. This way, you can make infographics for your company and get plenty of traction online.
Read on to find out more.
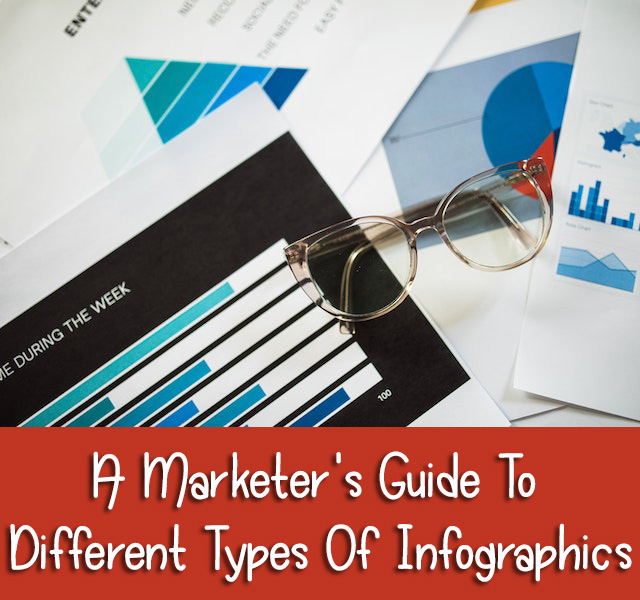
Data Visualization
It is used to represent complex data, allowing users to compare different trends and figures. It helps viewers stay focused and engaged by making it easier to spot patterns and outliers.
It is ideal for displaying quantitative data and can be used for a variety of applications, such as understanding customer patterns, visualizing budgets, identifying market trends, and tracking economic performance.
Interactive
They can be found in various formats, such as videos, 3D models, image maps, and animation. Interactive infographics have several advantages compared to traditional static graphics. It allows viewers to get more information at once, as well as interact with the content design while exploring it.
Illustrative
With illustrations being a key feature of illustrative infographics, they help to explain complex infographic ideas in a simpler way. The use of vibrant colors and shapes helps to add a fun and refreshing element to the audience’s viewing experience.
The dynamic nature of illustrative infographics can grab the viewer’s attention and convey a message. This type of infographic can be effective in promoting a brand, conveying key data, or presenting a market analysis.
Geographical
This type of infographic helps to identify patterns in data such as population, environmental conditions, trends, and other facts related to the geography of a given place.
These infographics are used in studies of population, economic development, environmental concerns, natural disasters, migration, and other topics and are sometimes used in the field of journalism.
For example, one might use a geographic infographic to chart the spread of a disease from one region to another or map the effects of climate change on a given country.
Educational
An educational infographic can be an effective way to share information with an audience. They use visuals to capture attention and make information easier to digest.
Educational infographics can be used to explain complex topics, explain how a process works, or provide step-by-step instructions. There are plenty of online tools available on how-to-create an infographic for free. This can provide an effective and attractive way to educate people about any subject.
Know the Different Types of Infographics and When to Use Them
Infographics are one of the best tools for illustrating data in inescapable detail and a great way to engage an audience. From data visualizations to flowcharts, graphs, and beyond, understanding the types of infographics marketers can use is essential.
As a marketer, consider the most effective use of infographics in your content creation strategy. Try it out today and see the impact of infographics on your audience engagement!
We hope you have enjoyed reading this post. Follow the rest of our blog for more informative and helpful posts like this.
Speak Your Mind